Market Analysis to Promote Plant-Based Burger in the Midwest Census Region.

Introduction:
The demand for wholesome and healthy food is on the rise as the society has become more health conscious. People start to adopt plant-based or plant-forward eating patterns focus on foods primarily from plants, which have been empirically proven to have tremendous health benefits. Furthermore, beside the wellness concerns, there are other reasons explaining for the shift of consumer’s regular diet to a new plant-based diet. For example, there is a clinging fear of an environmental crisis or consumers just do not want to carry the guilt of animal cruelty. Regardless, food manufacturers are in action to reap out the benefits from this highly potential and lucrative market. There are people who would consider plant-based diet but unable to convince themselves to forfeit their eating norms. In order to sell services to this particular segment of consumer, manufactures develop new type of product that does not only satisfy the plant-based criteria but also be able to bring out the same appetite sensations that traditional foods deliver. That is plant-based burger, which include plant-based meat burger and veggie burger.
This report will analyze how plant-based burger performs in the current market. Then, it will look at the general statistics to build different product profiles with preferred attributes and collect reception survey responses from targeted consumers in the Midwest region. Through interpreting the survey results and performing a conjoint/regression analysis on the data, the market strategy recommendation will be presented with the goal to make plant-based burger become more popular to traditional meat eaters and increase ROI. Overall, the final marketing plan will effectively capture what the consumers’ needs and wants and coordinate activities that guide businesses to success.
Market Insights and Important Considerations:
Once again, the market for plant-based products is exponentially expanding. According to a report managed by MarketsAndMarkets, plant-based meat industry is valued about 12.1 billion USD in 2019. And it is forecasted to grow at a compound annual growth rate of 15% from 2019 to reach 27.9 billion USD in 2025. As an oligopolistic market that guarantee a huge and positive economic gain, more companies want to enter in as soon as they can. Because of this, already established and long-time players like Tyson or Cargill start to take necessary actions to avoid losing market shares to their competitors. In specific, they invest more in start-ups who produce plant-based meat and delegate more of their capitals to make strong product improvements. For example, Cargill budgets additional 75 million dollars to propel PURIS Pea protein production to serve its surging market demand. In order to survive in a plant-based market, other product makers must always monitor and consider the moves of giants like Cargill or Tyson, so that a suitable marketing strategy and product modifications can be introduced to compete in sales and bring in more customers.
The ongoing demand for plant-based meat does not just happen without forces. Primarily, it is a result of the drastic change in consumers’ behaviors due to numerous reasons. First, consumers are more than ever overloaded with information of like how a tradition farming can be harmful to the planet or killing animals is wrong. Since information like this can be easily accessed through the Internet and all other means of social media, U.S consumers’ perception toward food is influenced. A survey conducted by Nielsen Homescan in 2018 shows that 61% of the respondents are happy to reduce meat consumption and 43% of respondents are eager to replace meat-based protein with plant-based protein alternatives. Hence, it is imperative to consider the psychological aspect of consumers when proposing a marketing strategy. Understanding what kind of product that they want and how they want it with supported data can increase the likeliness of consumers purchasing the product.
Study & Survey Design:
For the survey, the product is plant-based burger which includes both plant-based meat burger and veggie burger. The proposed serving size is 4 oz patties, and the target group are consumers in the Midwest Census Region. The model employs 3x2x3 attributes ratio. The first attribute is pricing with three different price sets including $2.99, $4.49 and $5.99. The second product attribute is nutrition including veggie and plant-based meat option. Table 1 presents the differences of nutritional content between these two items. In general, veggie burger contains slightly more calories than the plant-based meat burger. However, plant-based meat burger has a higher total fat. Total fat comprises of saturated fat and saturated fat is a potential source for type 2 diabetes and risk of heart disease. In comparison, plant-based meat burger contains approximately 7g of saturated fat and between 20–25g protein while Veggie burger contains about 2.5g of saturated fat for the larger amount of protein.

The next attribute under consideration is product labeling. There are seven common labeling claims in total. Table 2 explains in detail what they are the meaning behind each one.

There are total of 8 finalized product profiles to represent the attributes of price, nutrients and labels. Table 3 is used to showcase them in a detailed and logical manner. In addition, there are 8 additional survey questions incorporated in the survey. The additional questions provide the needed data for conjoint analysis. They also help with segmenting respondents into two groups: Group has little to no experience toward the product and Group has consumed similar product before. Table 4 summarizes the additional questions used to ask the respondents.


Last but not least, the script is an important part to get respondents to engage in the survey questions. For the survey, the script is presented as followed:
“With the increasing shift towards a plant-based diet for health and sustainability reasons, assume you too decided to switch to a plant-based diet. Plant-based burgers are meant to replace the burgers made from beef. Some of these alternatives are meant to mimic meat and some are ordinary veggie burgers. Suppose you go to your regular grocery store to shop for burger alternatives and find plant-based burgers that are differentiated based on their price, nutritional content and labelling claims. Circle a number to indicate how likely you are to purchase a plant-based burger alternative, where 1 indicates “not likely” to purchase and 10 indicates “very likely” to purchase.”
Survey’s Results and Findings:
There are 189 responses in total. The very first step is to examine whether or not the collected data closely resemble the region where the study takes place. The indicators here are age, gender, income and education. Overall, the survey data captures the true representativeness of educational level. Figure 1 illustrates that there is not much of a difference between the sample data and the Midwest area in this category. The average difference is only 2% to 3%.

However, it is a different story when it comes to income level. Based on Figure 2, much more people in low- and middle- income earning individuals (below $74,999) are included in the sample data than high income individuals (above $74,999). The data is concluded to overrepresent the low- and middle- income group and underrepresent the high-income group in the Midwest Census Region. The key takeaway is that income can be a significant factor that explains Midwest consumers’ different perspectives and behaviors toward plant-based burger.

Regarding age, Figure 3 indicates that the sample data tends to overrepresent the age group of 18 to 54 with the average difference of 6.5% and underrepresent the older age group. Furthermore, the sample data overrepresents female and underrepresents male (Figure 4).


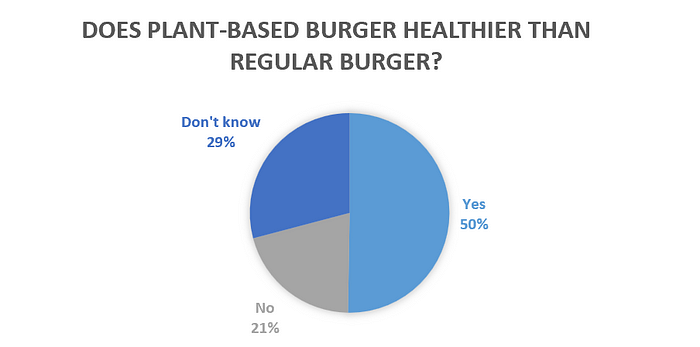
When asked about personal preference on plant-based burger, there is a split in response. Figure 5 and 6 shows that 50% and 62% of the respondents agreeing plant-based burger is healthier than regular burger and considering to incorporate it in their diet, respectively. However, when asked about whether or not they would be willing to try the product, more than 50% responses are left blank. These numbers show that consumers still do not have a concrete idea of what plant-based burger truly is and how it can be beneficial.

Responses to additional-questions section also help address why and why not Midwest population would eat plant-based burger. Figure 7 shows that concerns for personal health and for environment are key motivators for consumers to purchase the product. 33% of respondents think plant-based burger is a good option for diet and 39% of respondents think plant-based burger purchase can help alleviate animal welfare and environmental sustainability problem. Surprisingly, trending is not a big factor at all even though the product is more accessible and advertised to consumers more than ever in the digital age.

Figure 8 describes the factors that can make Midwest consumers not to buy the product. Overall, pricing is the biggest reason, followed by the worry of meat-eating sensations could not be replicated. Hence, addressing on pricing is a must-do for the marketing strategy later on. The three last figures conducted from the additional questions are used to see how segmented the data is in terms of experienced consumers and non-experienced consumers.

34% of respondents in Figure 10 says that they have not bought any the plant-based burger yet so they are not sure where they should buy it. On the contrary, experienced consumers have the intention to buy the product themselves in places like the grocery store. Merely about 19% would purchase it in fast-food restaurants and 7% of respondents would have it in a commerce setting such as restaurant. The high number on in-person grocery shopping infers to the lack of confidence in the product when it is handled by others. In addition, 74% of the respondents points out that plant-based beef burger is more preferable than veggie burger since it creates a sense of actual meat qualities (Figure 11)


Regression Model’s Results and Findings:
The regression model is built to discuss the relationship between product rating and different means of attribute. In other words, it demonstrates how the rating is affected when there are changes among chosen attributes. Like indicated, the regression is classified into two parts to address both groups of plant-based consumers in the study, including the overall group and the experienced group. Firstly, it is necessary to figure out which attributes are most significant in the model. Based on regression model summarized in Table 5, price is the most important attribute with followed by label and nutrient.

A second regression is generated with rating remains as a dependent variable while others interrelation of attributes are independent variables. The result of this regression is shown through Table 6. Price, Age and Income components are addressed more in depth since they are statistically significant in the model, while others are not. In specific, rating is decreased by 0.3 points when price increases by 1 dollar. Rating decreases by 0.2 points as age increases. Rating increases by 0.15 points when income goes up.

The summary of rating for 8 product profiles is illustrated through Table 7. Profile 3 has the highest predicted rating and average rating among the overall group. Hence, profile 3 should be advertised heavily to the overall group. With respect to the experienced group, Table 8 shows that Price, Age and Education are statistically significant. Noticeably, income is not a strong factor in influencing the buying decision of consumers who already try plant-based burger before. The analytic results of rating are as follows. Rating decreases by 0.39 points when price increases by one dollar. Rating decreases by 0.67 points when age increases. And rating increases 0.24 point when the level of education increases.


Table 10 captures the snapshot of ratings from experienced consumers toward 8 product profiles. Different from the overall group, the highest product rating in this group is profile 5. Profile 3 product is still favored by the experienced group over other profiles but not as much as profile 5.

Marketing Plan and Recommendations:
From the analysis results, it is imperative to determine an optimal price range for consumers from the Midwest market. The viable price range should be from $2.99 to $4.49 per 2oz patties. The exact price in this price range can be further identified based on specific regions and their demographic characteristics.
About label, plant-based burger should incorporate the label of Non-GMO, Soy-free and Gluten-free, Excellent source of protein, no artificial flavors since it is the label with the highest rating in both overall and experienced groups.
Through breaking down additional data, consumers are observed to have the habit of purchasing plant-based burger and cook for themselves instead of going restaurant to have it. One possible explanation for this behavior is the lack of trust in the product when consumers do not see how it is prepared. This information suggests the marketing effort to focus on placing fully-packaged product in different grocery stores instead of trying to sell it through dining businesses.
In addition, the marketing plan should advertise the product to young to and middle age group. This can be said since 41% of the respondents are from 18–54 and indicate that they are willing to try plant-based burger. In terms of income and education, the product is more likely to be purchased with a high income or highly educated individual. With this notion, the distribution of the product should be more concentrated in more upscale grocery stores like Hy-Vee and Whole Foods.
The regression of the dataset shows that consumers prefer veggie burger than plant-based burger despite almost 74% of the respondent choose plant-based meat burger in the additional questions section. This alarms that consumers can be a little bit oblivious toward the product label. They might just buy because the product is plant-based no matter what ingredients and nutrients being listed. The strategy hence should aim to increase the awareness of consumers about the product itself. Let them know the differences between marketed products so that they can make an informed choice.
References:
Babauta, Leo. “A Guide to Eating a Plant-Based Diet.” Zen Habits RSS, 27 Sept. 2012, https://zenhabits.net/plants/.
“Cargill Invests Additional $75 Million to Propel PURIS Pea Protein Production in the US to Meet Surging Market Demand.” Cargill, Cargill, Incorporated., 28 Aug. 2019, https://www.cargill.com/2019/cargill-invests-additional-$75-million-to-propel-puris-pea.
Carrington, Damian. “Avoiding Meat and Dairy Is ‘Single Biggest Way’ to Reduce Your Impact on Earth.” The Guardian, Guardian News and Media, 31 May 2018, https://www.theguardian.com/environment/2018/may/31/avoiding-meat-and-dairy-is-single-biggest-way-to-reduce-your-impact-on-earth.
Carter, Stephen. “A Vegan Sued Burger King Over Its ‘Impossible Whopper.’ He Has a Point.” Bloomberg.com, Bloomberg, 24 Nov. 2019, https://www.bloomberg.com/opinion/articles/2019-11-24/why-vegan-s-impossible-whopper-lawsuit-vs-burger-king-matters.
Data Access and Dissemination Systems (DADS). “American FactFinder.” American FactFinder, U.S. Department of Commerce, 0 Oct. 2010, https://factfinder.census.gov/faces/nav/jsf/pages/index.xhtml.
FMCG & Retail, CPG. “Was 2018 the Year of the Influential Sustainable Consumer?” Nielsen, The Nielsen Company (US), LLC, 17 Dec. 2018, https://www.nielsen.com/us/en/insights/article/2018/was-2018-the-year-of-the-influential-sustainable-consumer/.